ELAINE HALL
Assistant Resource Manager
Everyone secretly loves statistics. Especially record breaking statistics. During the Olympics we are hooked on whether an athlete is going to break a record, or when the last record was set and by whom. We are enamored by how fast, far or high someone can push themselves to go.
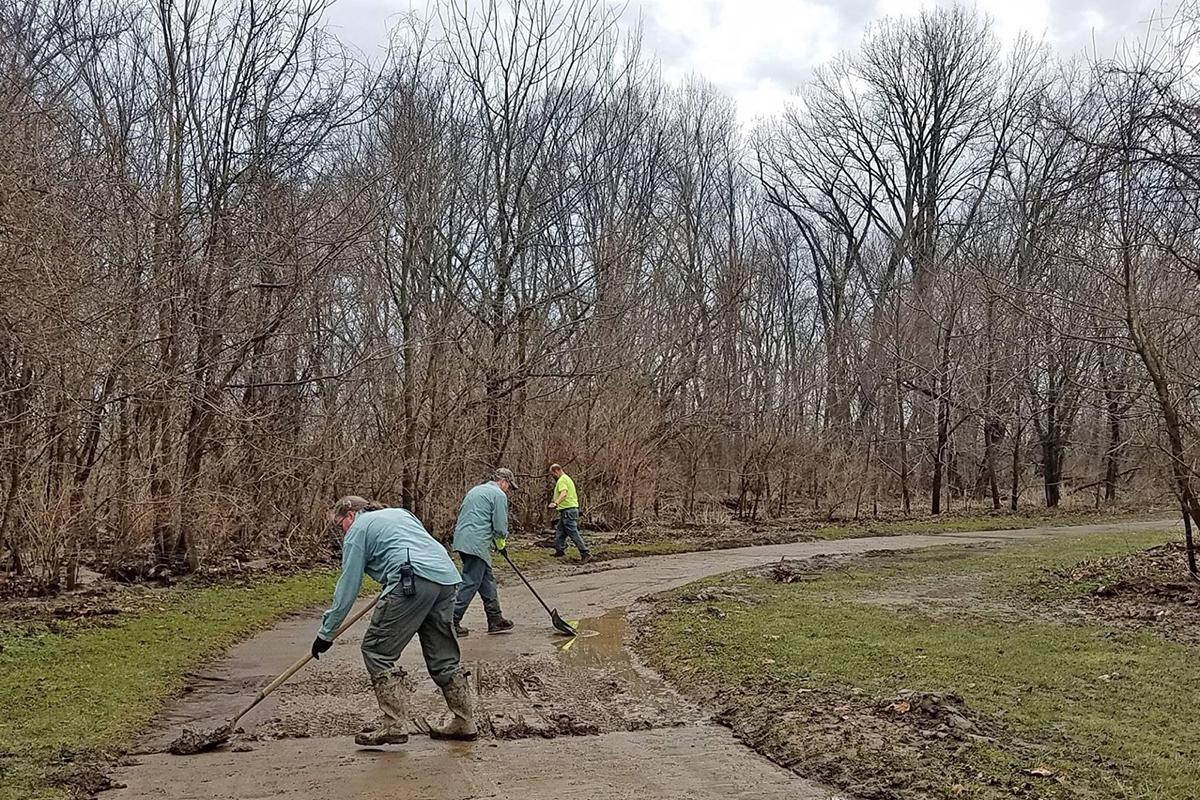
We also track similar stats for water. How fast, slow, high, low, hot and cold are among a few stats we keep for our rivers and streams. Peak flow of a river is generally the most well documented statistic. Stream conditions in winter and spring attract the most attention, because melting snow and spring rains bring flooding. Floods are flashy. They are high energy events that become dangerous in the blink of an eye.
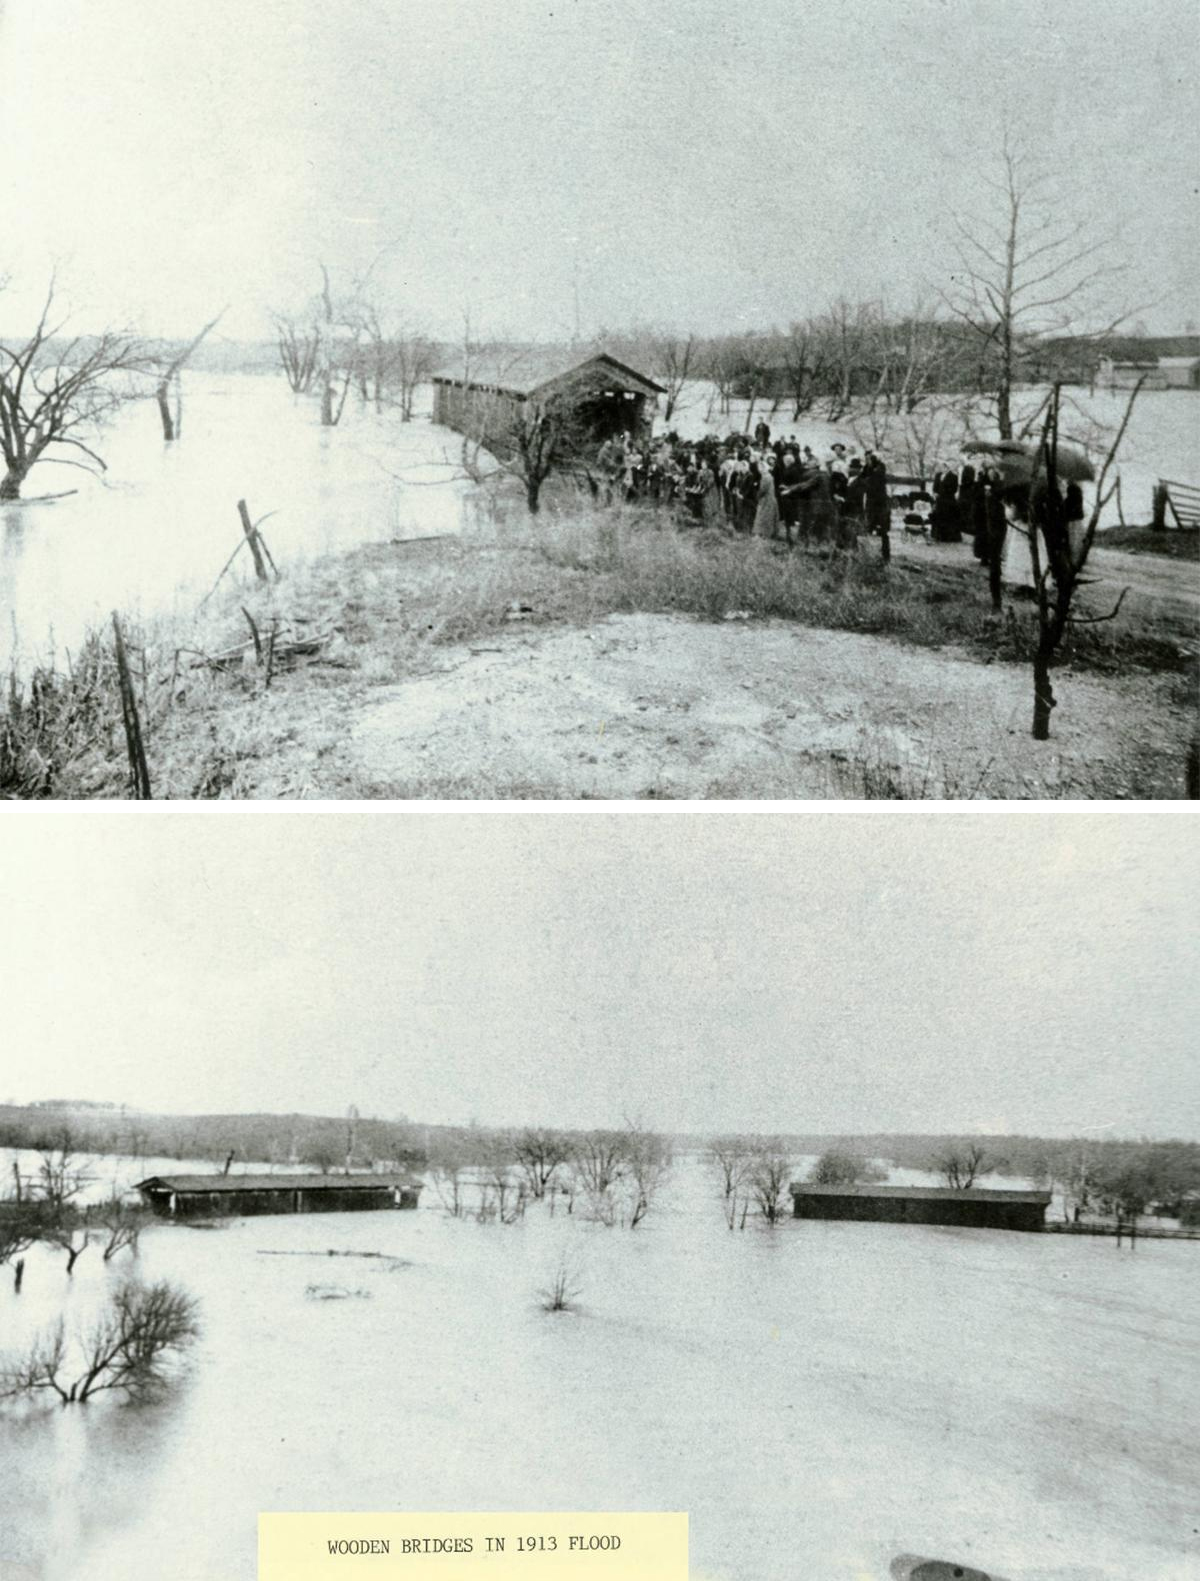
Historically for our area The Great Flood of 1913 is still considered the record high flood event. Though today modern methods of monitoring stream levels have been implemented. United States Geological Survey (USGS) gauges were installed after 1913 and are tracking various river data, mostly flow rates measured in cubic feet per second (cfs).
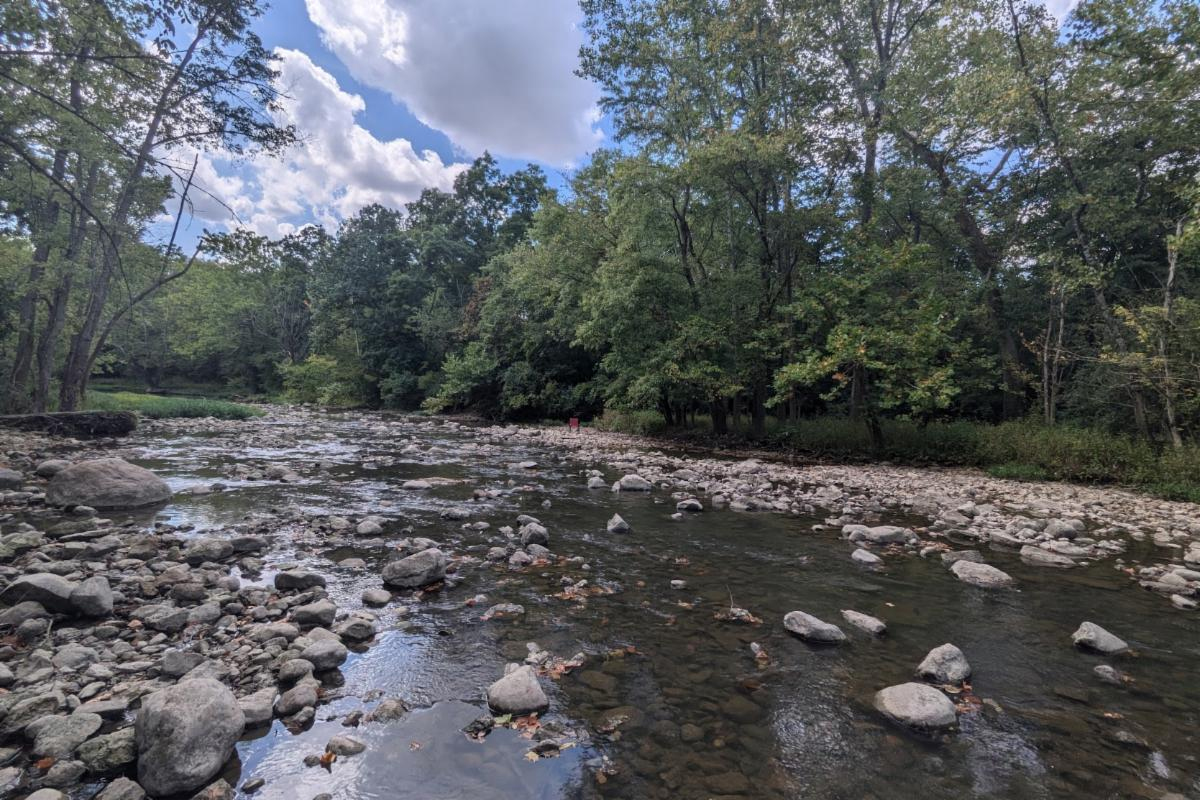
Through summer, watersheds in our area receive less rain, so less water reaches the streams. This reduces water levels and the flow of the river or stream crawls to sluggish rates. In years where there is little to no rain drought becomes a concern. The inverse of rampaging flooding is drought, which imposes a painstaking stress on water ecosystems.
Drought conditions negatively impact freshwater ecosystems with immediate effects on fish, mussel and invertebrate species. Shallow water warms more quickly and changes the water chemistry as organisms use up oxygen and nutrients in whatever pool of the stream they happen to get stranded in.
Many local streams that have USGS gauges in them have been collecting data since the early 1920s. Record-breaking low levels occurred during the Dust Bowl Era. This time period was about a decade’s worth of little to no rain around the 1930s that caused severe drought across most of the country. As a result, the Dust Bowl Era was so-named for the massive amounts of dust that swept across the midwest due to the drought and poor soil conservation practices at the time.
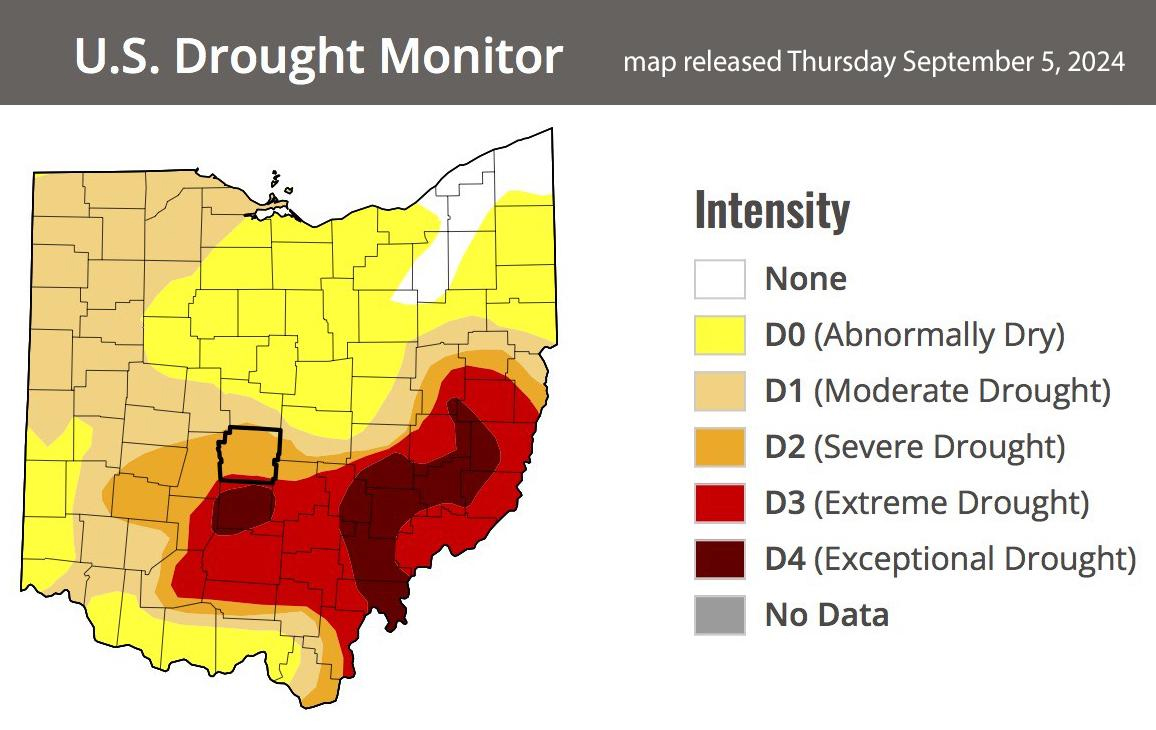
Currently Franklin County is experiencing a D2 Severe Drought according to the US Drought Monitor. In discussions with Franklin County Soil and Water Conservation District, we learn that Franklin County is seeing almost 8 inches of rain deficit, making this the driest summer since 1948. Just south of Franklin County, Pickaway County is enduring a D4 Exceptional Drought.
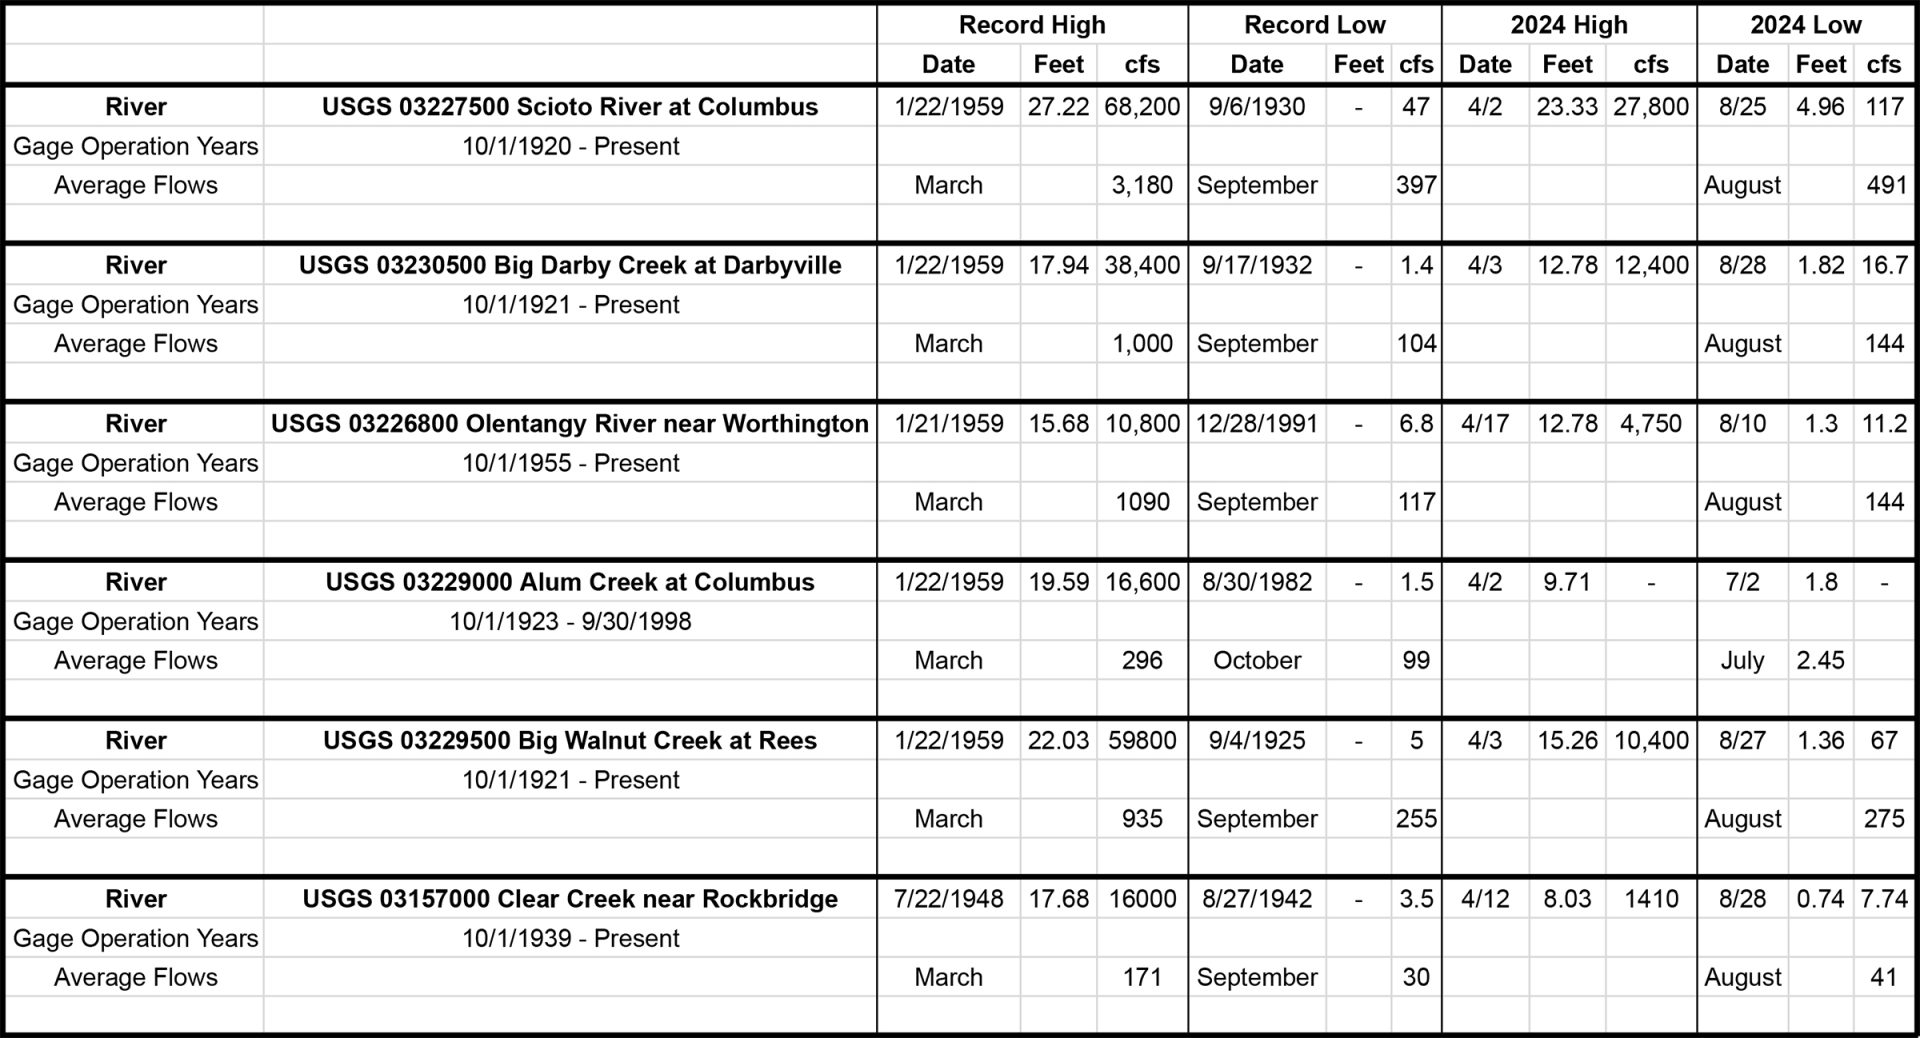
Temperatures have been 1 to 4 degrees above the norm and streams have received below-normal rainfall. September is usually the month our streams experience their lowest flows. So how does this year, so far, statistically compare to years past? Here is how our streams are currently measuring up as of August 28, 2024.
On either end of the spectrum water levels influence our ability to offer safe programs or to publicly recreate. Naturalists keep a watchful eye on water levels as they prepare for programs like creeking, and rangers post notice of water level status and conditions for paddlers and anglers.


I enjoyed your article, Elaine! Very informative
Table and resource are great-thanks